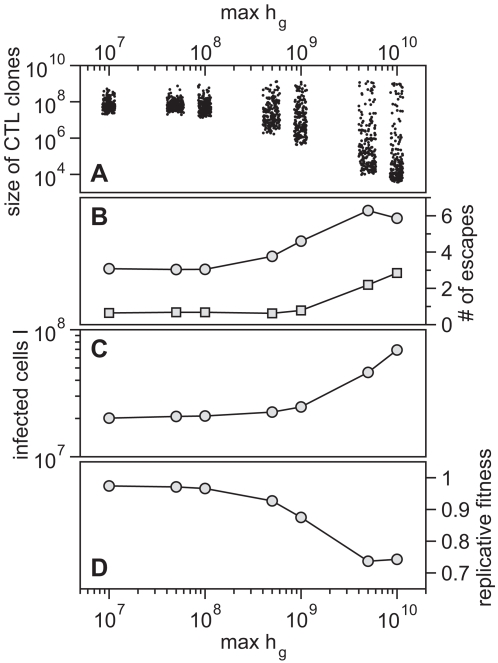
Figure 6. Influence of Immunodominance on Viral Evolution.
(A) The distribution of CTL clones plotted as a function of  . Lower values of
  yield a broad repertoire of CTL clones that are similar in size whereas for higher
  the degree of immunodominance increases. The dots represent the size of CTL clones for 10 simulations at 50 days after infection. Noise is added on the horizontal axis for better visibility. (B) Escape is more frequent for a higher degree of immunodominance. The numbers of escape variants that have occurred within 5 years of infection are shown as circles. As many escapes start to oscillate or revert back to wild-type, the number of escapes that are above 50% in frequency at 5 years after infection is shown as squares. (C) Infected cell numbers increase with increasing immunodominance. (D) The replicative fitness of the virus decreases with increasing immunodominance. Numbers are given after 5 years of infection and represent averages from 1000 simulation runs.

