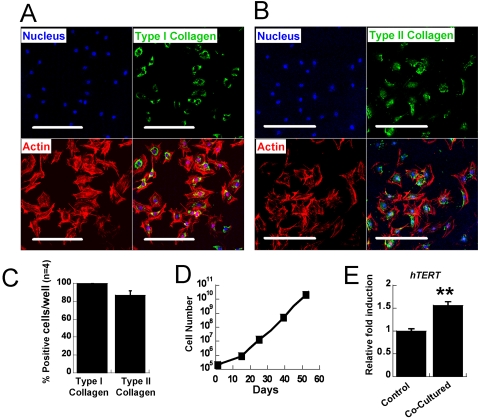
Figure 2. Characterization of chondrogenically-committed cells.
At P1 most of the cells stained positive for both Types I and II collagen. (A) Immunostaining of Type I collagen and (B) Type II collagen at P1. (C) Quantification of cells positive for Types I and II collagen at P1 (n = 4 wells). (D) Proliferation rate of the chondrogenic-committed cells was measured by counting the cells during expansion. (E) At P1, chondrogenic-committed cells showed enhanced expression of telomerase gene compared to that of hESCs that were not cocultured (at P1). (** P<0.01, bar = 100 µm)

