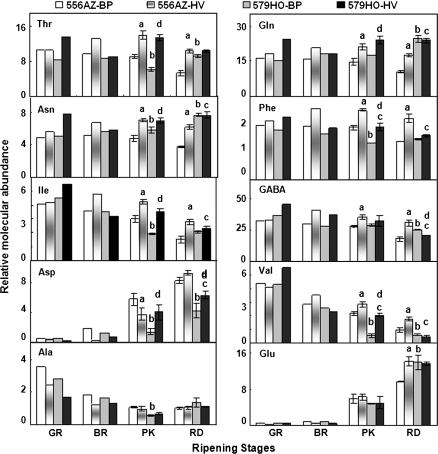
Fig. 3.
NMR spectroscopic analysis of amino acids in ripening fruit of transgenic (579HO) and non-transgenic (556AZ) plants grown in BP and HV mulch systems. Letters a, b, c, and d marked above the bars indicate significant differences, P <0.05, respectively, between 556AZ-BP and 556AZ-HV, 556AZ-BP and 579HO-BP, 556AZ-HV and 579HO-HV, and 579HO-BP and 579HO-HV. Data shown are means ±SE (n=3–5). Only significant differences during late ripening stages are highlighted. Other details are as in Fig. 2.

