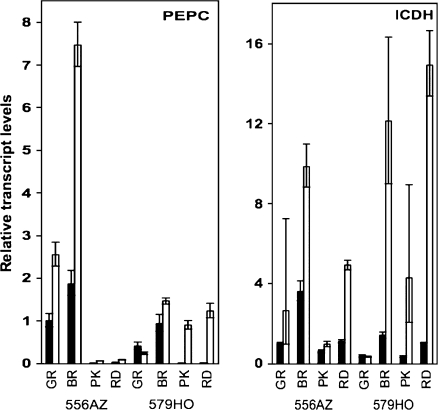
Fig. 6.
Real-time PCR analysis of LePEPC2 (A) and LeICDH (B) transcripts at different ripening stages of fruit from control 556AZ line and the transgenic 579HO line grown in BP (filled bars) and HV (open bars) mulches. The levels of PEPC2 and ICDHc transcripts were determined relative to the calibrator azygous (556AZ) at green (GR) stage from BP-grown plants. The range in variation is shown as error bars, which was determined by evaluating the expression 2–ΔΔCT with ΔΔCT+s and ΔΔCT–s, where s is the standard deviation of the ΔΔCT value (n=3). Closed and open bars represent BP-grown and HV-grown fruits, respectively.

