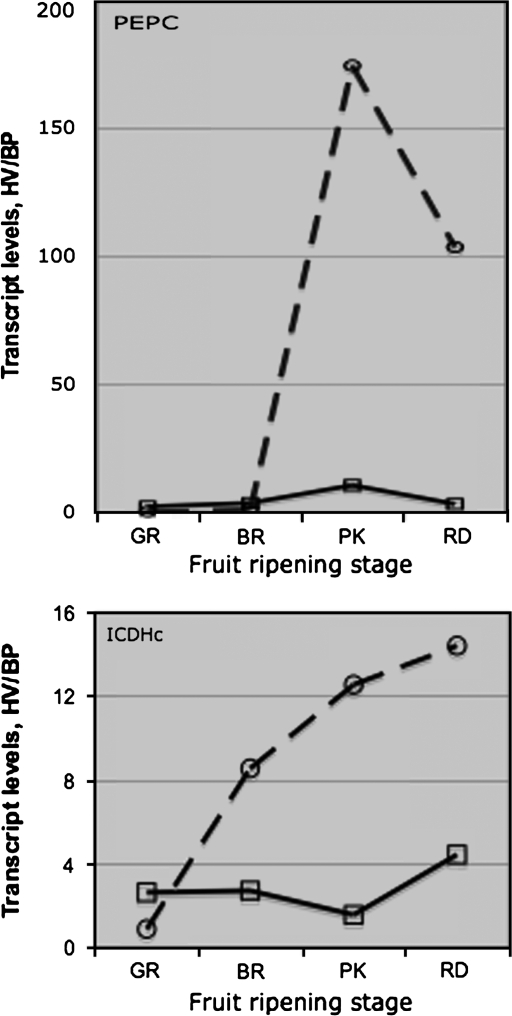
Fig. 7.
Ratio of PEPC and ICDHc transcript levels, respectively, in HV mulch to that in BP in 556AZ (open rectangles) and 579HO (open circles with dotted line) fruit at different stages (GR, BR, PK, RD) of ripening. Data from Fig. 6 were used to generate this figure. Solid and broken lines represent fruits from 556AZ and 579HO genotypes, respectively.

