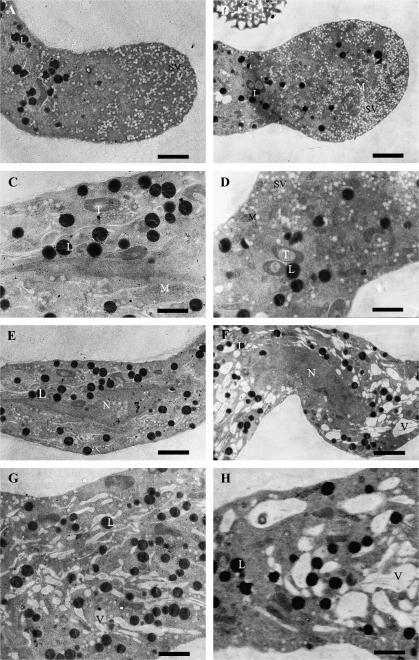
Fig. 3.
TEM images of control (A, C, E, G) and IAA-treated (B, D, F, H) pollen tubes after 2 h of culture of Torenia fournieri. (A) The clear zone of a control tube, showing the vesicle-rich zone. (B) The clear zone of a treated tube, showing a dramatic increase in secretory vesicles (SVs) and appearance of organelles, e.g. mitochondria (M) in this zone. (C) The organelle zone of a control tube, showing some organelles, such as mitochondria, trophoplasts (T), and lipid bodies (L). (D) The organelle zone of a treated tube, showing more SVs and mitochondria. (E) The nuclear zone of a control tube, showing the spindly tube nucleus (N). (F) The nuclear zone of a treated tube, showing the spindly tube nucleus and abundant vacuoles (V). (G) Subapical region of a control tube filled with long strip-shaped and small round-shaped vacuoles. (H) Subapical region of a treated tube occupied by big vacuoles. Bars = 1.6 μm (A, G), 2 μm (B, F), 1 μm (C, D), 1.8 μm (E), 1.3 μm (H).

