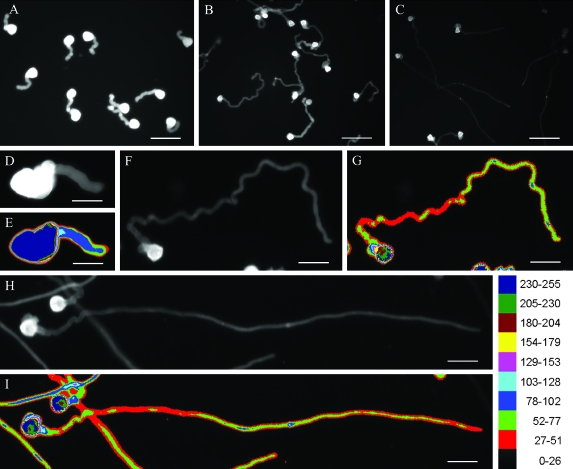
Fig. 6.
Effects of IAA on the distribution of cellulose in Torenia fournieri pollen tubes cultured for 1 h (A, D, E) and 2 h (B, C, F–I). Controls (A, B, D–G) and IAA-treated (C, H, I) tubes were labelled with calcofluor white. (A–D, F, H) Cellulose fluorescence images of pollen tubes. (E, G, I) Pseudocolour images of pollen tubes corresponding to (D), (F), and (H), respectively. The colour scale referred to cellulose fluorescence intensities. Bars = 95 μm (A), 146 μm (B), 182 μm (C), 39 μm (D, E), 53 μm (F–I).

