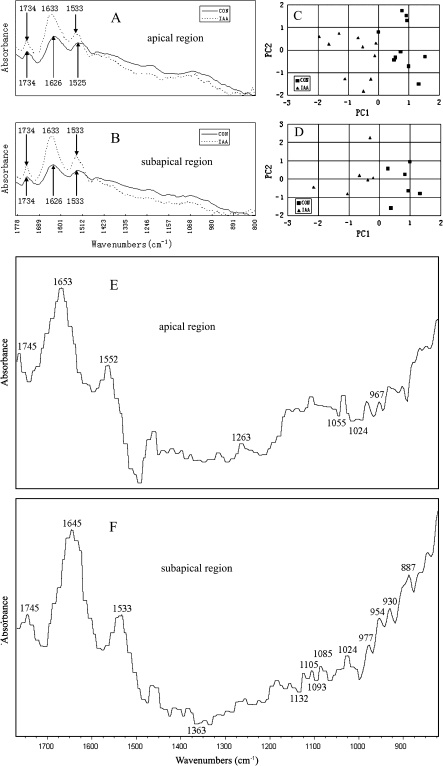
Fig. 7.
Analysis of FTIR spectra from pollen tubes of Torenia fournieri. (A, B) Average FTIR spectra obtained from the apical region (n=10) (A) and subapical region (n=6) (B) of pollen tubes cultured for 2 h under control conditions (CON) or treated with 4 mg l−1 IAA (IAA), showing IAA treatment induced displacements of the peaks or changes in absorbance. (C, D) Typical score plots obtained from principal component analysis applied to the cell-wall spectra in the apical region (C) and subapical region (D) for the IAA-treated (IAA) and the control (CON) tubes. Best separation was obtained with the first principal component (PC1) score. (E, F) Difference spectra generated by digital subtraction of CON spectra from IAA spectra of the apical (E) or subapical region (F), showing that the content of proteins and pectin increased while the content of cellulose decreased after IAA treatment.

