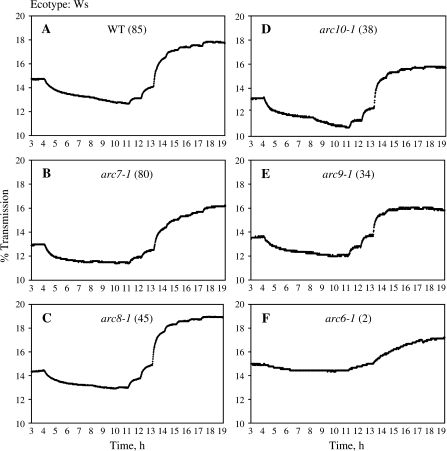
Fig. 5.
The percentage transmission of Arabidopsis thaliana leaves (ecotype Wassilewskija). Each graph is a representative trace for the respective plant types. Plants were dark-adapted overnight. Mature leaves were then harvested and placed in a device measuring the light transmission of the leaves at increasingly high blue light intensities for a total of 19 h (1–4 h, dark; 4–7 h, 0.1 μmol photons m−2 s−1; 7–8 h, 0.2 μmol photons m−2 s−1; 8–9 h, 0.4 μmol photons m−2 s−1; 9–10 h, 0.8 μmol photons m−2 s−1; 10–11 h, 1.6 μmol photons m−2 s−1; 11–12 h, 5 μmol photons m−2 s−1; 12–13 h, 10 μmol photons m−2 s−1; 13–14 h, 30 μmol photons m−2 s−1; 14–15 h, 40 μmol photons m−2 s−1; 15–16 h, 50 μmol photons m−2 s−1; 16–17 h, 60 μmol photons m−2 s−1; 17–18 h, 90 μmol photons m−2 s−1; 18–19 h, 100 μmol photons m−2 s−1).

