Figure 5.
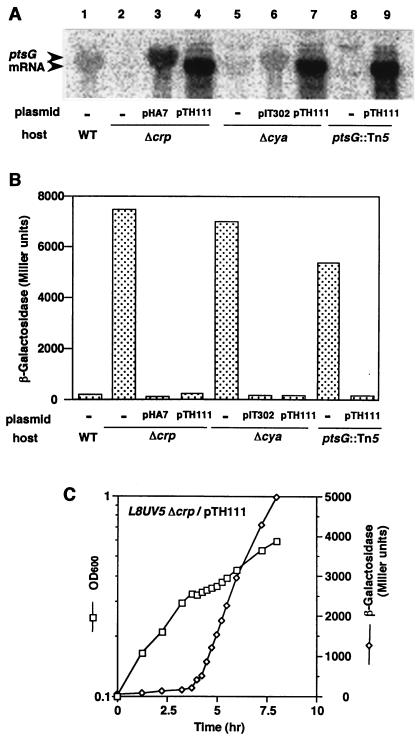
Glucose effect and the expression of ptsG gene in lacL8UV5 cells. (A) Northern blot analysis of the ptsG mRNA. Cells were grown in M9 medium containing 0.5% glucose and 0.5% lactose. Total RNAs, 50 μg (lanes 1, 2, 3, 5, 6 and 8) or 5 μg (lanes 4, 7 and 9), isolated from PR166 (lane 1), KK17 (lane 2), KK17 harboring pHA7 (lane 3), KK17 harboring pTH111 (lane 4), KK8 (lane 5), KK8 harboring pIT302 (lane 6), KK8 harboring pTH111 (lane 7), KK20 (lane 8), and KK20 harboring pTH111(lane 8) were subjected to Northern blot analysis. (B) Cells were grown in M9 medium containing 0.5% glucose and 0.5% lactose. β-Galactosidase activity was determined at OD600 of 0.6. Each value is the average of three experiments. (C) KK17 cells harboring pTH111 were grown in M9 medium containing 0.04% glucose and 0.2% lactose. At the indicated time, samples were removed to determine the OD (squares) and β-galactosidase activity (diamonds).

