Figure 4.
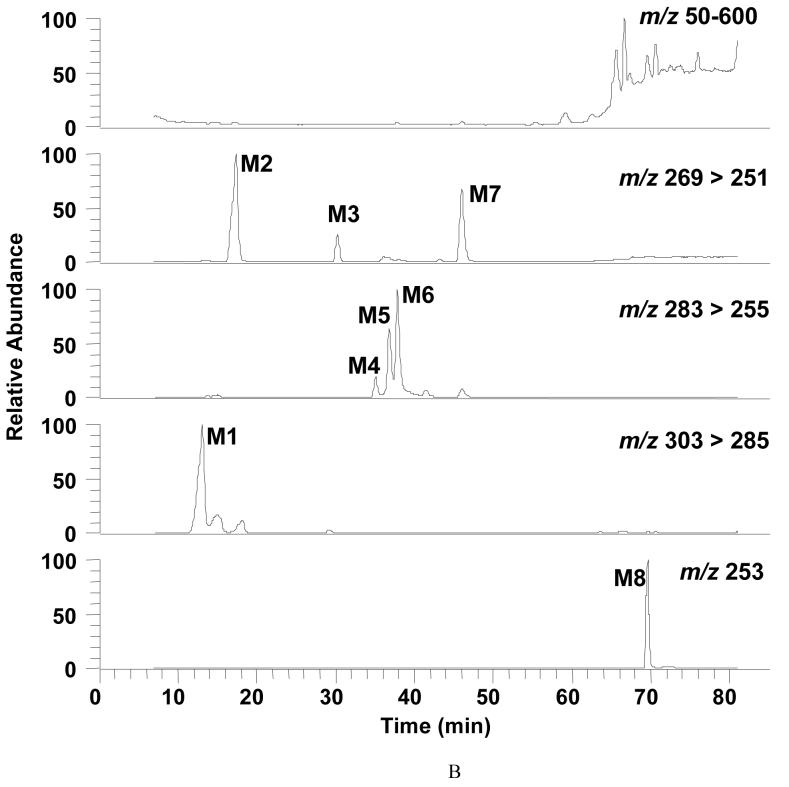
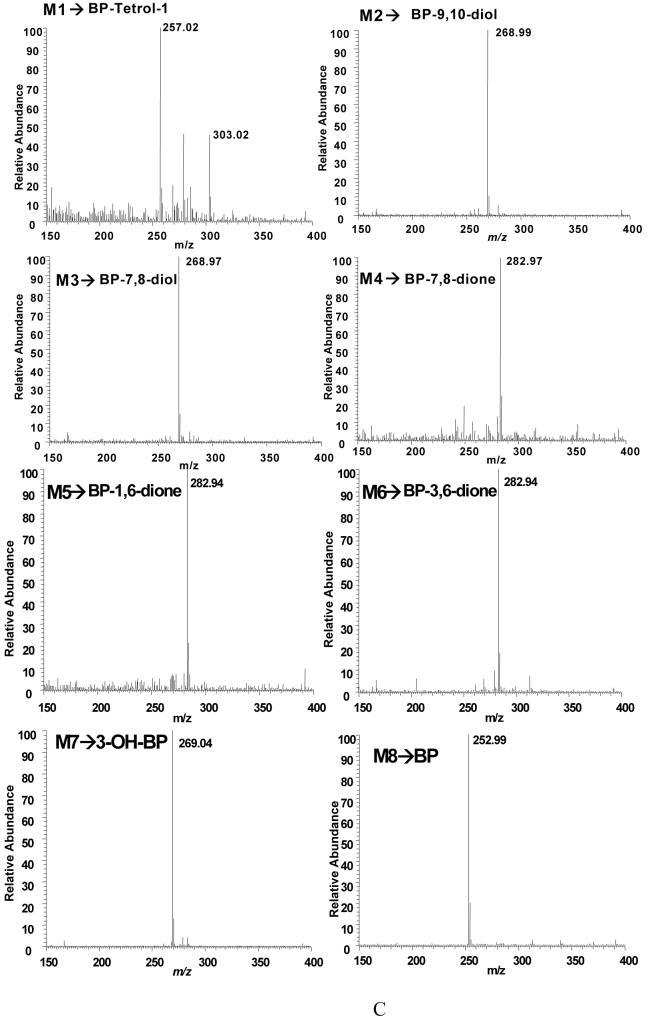
Detection of B[a]P-metabolites in parental H358 Cells by LC-MS. Cells (2 × 10⁷) were treated with unlabeled 4 μM unlabeled B[a]P for 12 h and the total culture mixture extracted with ethyl acetate. The organic extracts were dried and redissolved in methanol for LC-MS analysis. Chromatographic data were obtained following separation on an ODS column. Mass spectral data were obtained using a Finnigan TSQ Quantum Ultra AM Spectrometer equipped with an APCI source that was operated in the postive ion mode. Analytes were separated by RP-HPLC and the eluant on-line was monitored by the mass spectrometer in the SRM Scan and Q3 full scan modes. The SRM was used to detect the following ion transitions: m/z 269 [M+H-H2O]+ → m/z 251 [M+H-2H2O]+ for B[a]P-dihydrodiols (B[a]P-7,8- and 9,10-dihydrodiol); m/z 269 [M+H]+ → m/z 251 [M+H-H2O]+ for 3-OH-B[a]P; m/z 283 [M+H]+ → m/z 255 [M+H-CO]+ for B[a]P-quinones (B[a]P-7,8-, 1,6-, and 3,6-dione); m/z 303 [M+H-H2O]+ → m/z 285 [M+H-2H2O]+ for B[a]P-tetraol-1; and m/z 253 [M+H]+ for B[a]P. Q3 scan was used to obtain mass spectrum of analytes. Panel A, SRMchromatograms of the authentic standards for B[a]P-tetraol-1, B[a]P-9,10-dihydrodiol, B[a]P-7,8-dihydrodiol, B[a]P-7,8-dione, B[a]P-1,6-dione, B[a]P-3,6-dione, 3-OH-B[a]P, and B[a]P (from the top to the bottom). Panel B, SRM chromatograms of cell organic extract following 12-h B[a]P treatment. M1, B[a]P-tetraol-1, 15.9 min; M2, B[a]P-9,10-dihydrodiol, 20.7 min; M3, B[a]P-7,8-dihydrodiol, 35.0 min; M4, B[a]P-7,8-dione, 40.4 min; M5, B[a]P-1,6-dione, 45.1 min; M6, B[a]P-3,6-dione, 47.1 min; M7, 3-OH-B[a]P, 59.2 min; M8, B[a]P, 78.0 min. Panel C, mass spectra of the B[a]P metabolites in H358 cells.


