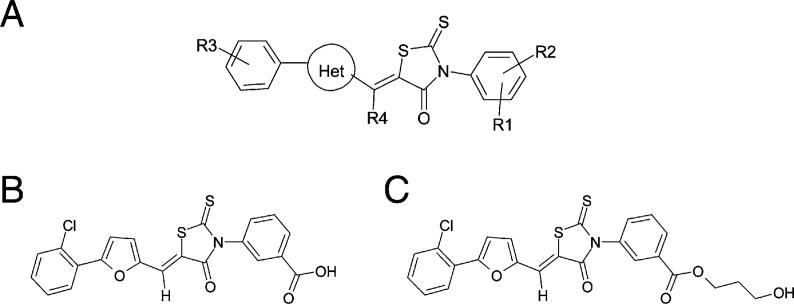
Figure 2. Structures of Inhibitors.
(A) Structure-activity relationship. Regioisomer (Z) orientation is based on X-ray crystallography of D155931. Substituents are listed in order from most to least potent (activity profile) or most to least selective for Mtb versus mammalian PDH (selectivity profile). Activity profile: R1 = 3-COOH > > 3-(CH2)2COOH > 4-SO2NHCOCH3 > 4-OH > 4-SO2NH2 > 3-SO2NH2 > 3-OH > 3-COCH3 > 4-COOH; R2 = H > 4-OH > 4-Cl > 6-Cl > 6-F > 6-CH3 > 6-OCH3; R4 = H > CH3 > > OH; Het = 2,5-furyl > > 2,5-thiazolyl > 2,6-pyridinyl > 2,5-oxazolyl > 2,4-isoxazolyl; R3 = 4-alkyl [Alkyl:CH3,ethyl,isopropyl, tert-butyl] > > 3-isopropyl > 2, 3 or 4-Cl > 2-OCH3 > 2-methyl or ethyl > 4-Br. Selectivity profile: R1 = 3-COOH; R2 = H; R4 = H; R3: site of substituent = 2 > > 3 > 4, substituents = Cl ∼F>CH3 > > OCH3 > OH > NH2; Het = 2,5-furyl.
(B) Structure of D155931 (3-((Z)-5-((5-(2-chlorophenyl)furan-2-yl)methylene)-4-oxo-2-thioxothiazolidin-3-yl)benzoic acid).
(C) Structure of D157070 (3-hydroxypropyl 3-((Z)-5-((5-(2-chlorophenyl)furan-2-yl)methylene)-4-oxo-2-thioxothiazolidin-3-yl)benzoate).

