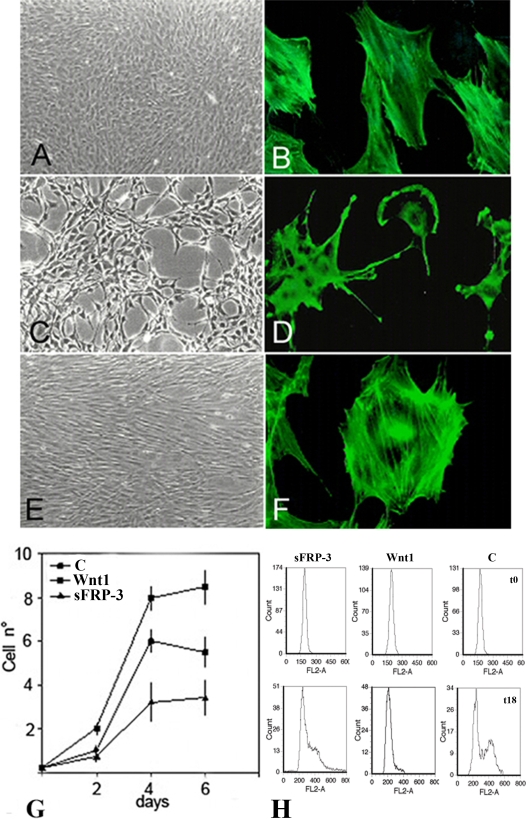
Figure 1. sFRP-3 modifies cytoskeleton and reduces proliferation of C3H10T1/2 fibroblast.
Morphology of C3H10T1/2 cells infected with vectors expressing puro cDNA (A), sFRP-3 cDNA (C), Wnt-1 cDNA (E). When stained for F-actin with falloidin (see Materials and Methods) both control cells (B) and Wnt-1 expressing cells (F) showed well organize stress fibers, whereas sFRP-3 expressing cells (D) showed membrane ruffles, filopodia and disorganized actin fibers. (G) Growth curves for control, Wnt-1 and sFRP-3 expressing cells. Cells were plated at an initial density of 2×10⁴ cells/60 mm dish in DMEM 5% FCS and re-fed on day 2 and 4. Cell numbers were measured by detaching cells with trypsin and counting triplicate samples for each point. (H) C3H10T1/2 cells stably transfected with sFRP-3, Wnt1 expression vector or empty vector as control (C), maintained in DMEM 10% FCS, were starved in DMEM serum free medium. After 24 serum was added again to the medium and cells analyzed for their DNA content by flow cytometry after Propidium Iodide, staining after 0, 18 and 20 h. Representative plots are shown in the upper panel for the three cell lines at t0 (upper plots) and t18 (lower plots).

