
Figure 2.
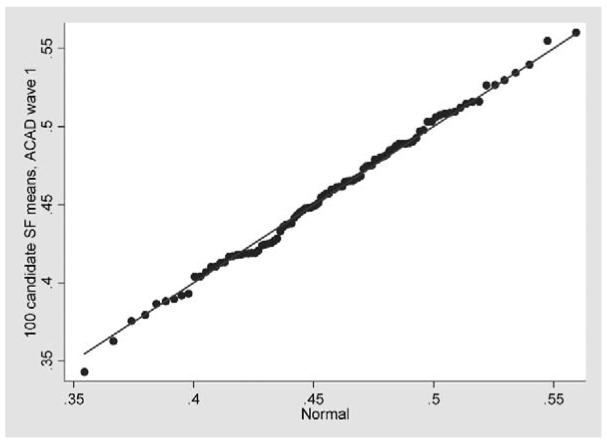
Quantile-quantile plot comparing the distribution of 100 candidate short-form means in Wave 1 of the Australian Child to Adult Development data with a normal distribution with the same mean and SD.
Official websites use .gov
A
.gov website belongs to an official
government organization in the United States.
Secure .gov websites use HTTPS
A lock (
) or https:// means you've safely
connected to the .gov website. Share sensitive
information only on official, secure websites.
Quantile-quantile plot comparing the distribution of 100 candidate short-form means in Wave 1 of the Australian Child to Adult Development data with a normal distribution with the same mean and SD.