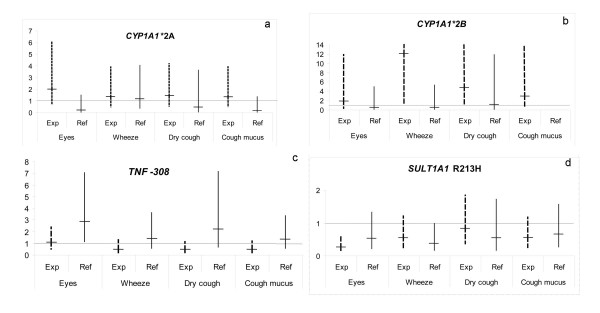
Figure 1.
a-d. Symptoms comparing different genotypes among TDI-exposed workers (exp) and non-exposed subjects (ref). Effect estimates are presented as crude odds ratios. Reference/variant genotypes are CYP1A1*2A A/B+C, CYP1A1*2B II/IV, TNF-308 GG/GA+AA and SULT1A1 R213H GG/GA+AA. A 95% confidence interval is indicated. Values above the Y-axis are indicated with Arabic numbers. Significant values are displayed in Table 2.

