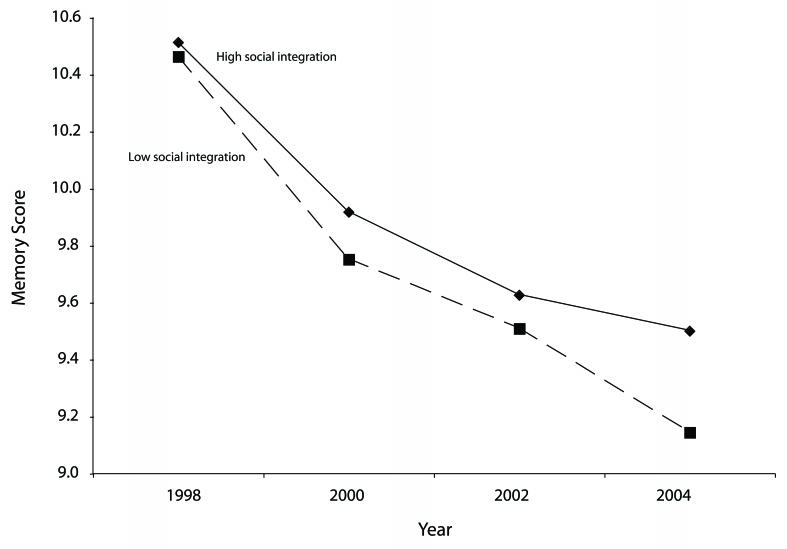
FIGURE 1—
Flexible growth-curve models showing predicted change in memory scores across 6 years of follow-up, by level of social integration at baseline: Health and Retirement Study, United States, 1998–2004
Note. Models adjusted for age at baseline; age squared; sex; wealth; income; race; education; Center for Epidemiological Studies Depression Scale; health conditions; mobility; large muscle index; activities of daily living; instrumental activities of daily living; time indicator variables for 2000,2002, and 2004; and interaction terms between each time variable and level of social integration.

