
Figure 2.
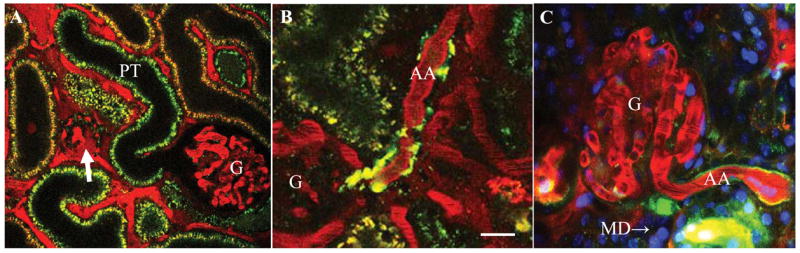
In vivo multi-photon imaging of the intact rodent kidney (A–B: rat, C: mouse). Rhodamine B-conjugated 70 kD dextran (red) was given iv to label the cortical vasculature (plasma). Quinacrine (green) is a strong marker of renin granular content in the afferent arteriole (AA) and it also weakly stains renal tubules (proximal tubule, PT). A: In vivo imaging of the STZ-diabetic kidney and visualization of glomerular permeability. A sclerotic (arrow) and a hyperfiltering glomerulus (G) are shown. Note the intense ultrafiltration of the high molecular weight (70 kD) dextran-rhodamine B (red) from the plasma into the Bowman’s space in the sclerotic, but not in the hyperfiltering glomerulus. B: In vivo imaging of the juxtaglomerular renin content in the diabetic kidney treated with an angiotensin II type 1 receptor (AT1) blocker. Note the significantly increased renin content around the juxtaglomerular portion of the afferent arteriole (AA). C: Multi-photon image of the proximal (P) and juxtaglomerular (JG) segments of the afferent arteriole (AA) in mouse. Content of individual renin granules is labeled by quinacrine (green). The vascular endothelium is labeled by the endocytosis of lucifer yellow (yellow). Note the intense and continuous yellow labeling in the proximal AA segment compared to the weakly fluorescent dash-dot pattern in the JG, renin-positive part. MD: macula densa. Scale is 20 μm.