
Figure 3. Viability and health of transfected cerebellar granule neurons (CGNs).
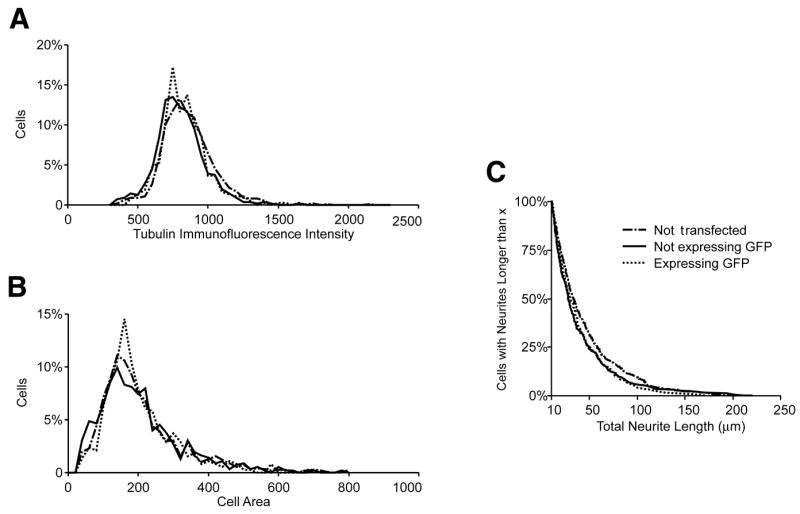
Data are presented as standard histograms for (A) tubulin immunofluorescence and (B) cell body area. (C) Total neurite length profile is presented as a cumulative probability histogram. In all plots, dashed lines represent neurons that were electroporated without plasmid (not transfected, n = 539). Solid lines represent neurons that were electroporated with green fluorescent protein (GFP) cDNA, but were not expressing GFP after 48 h (n = 263). Dotted lines represent GFP-expressing neurons in the same wells (n = 210). Total neurite length was included only for values >10 μm. In the histograms, the y-axis reports percentage of total neurons, normalizing for the different number of cells in the three populations.