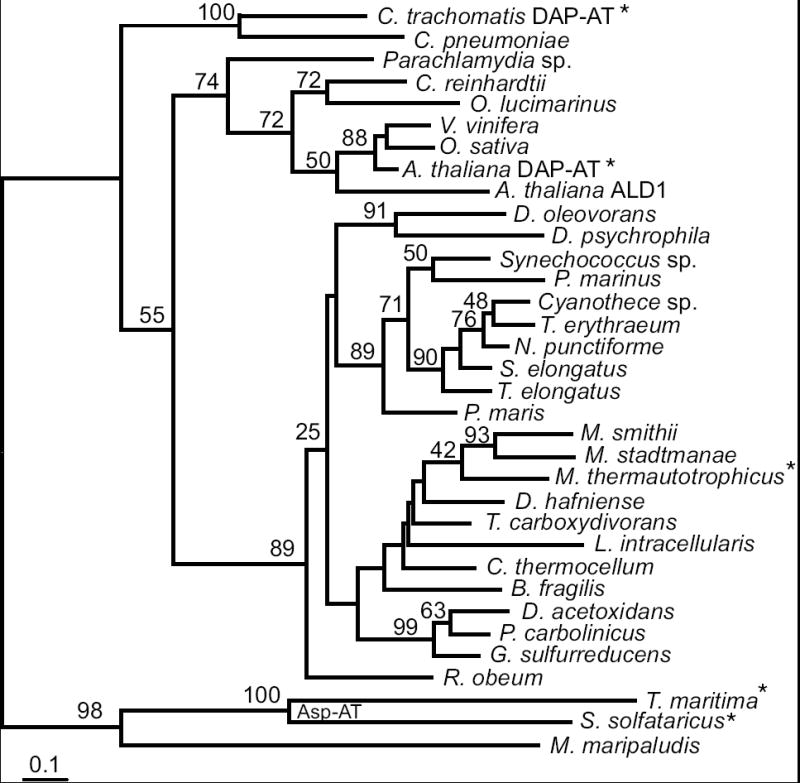
Figure 5.

Phylogram of the DapL homologs inferred by the protein maximum likelihood method. Bootstrap values from are shown near branches supported by a plurality of 100 trees. This tree is rooted using known aspartate aminotransferases enzymes and the closest homolog from M. maripaludis (MMP1527). Enzymes whose functions have been experimentally confirmed are indicated by an asterisk. The scale bar indicates one amino acid substitution per 10 positions. Sequence details are described in the Supplementary materials.
