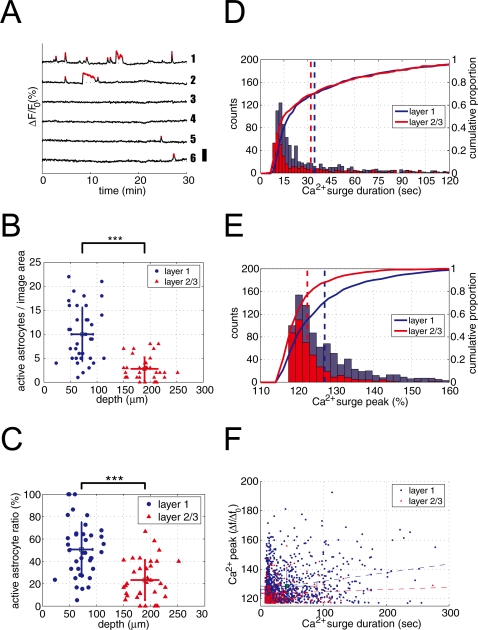
Figure 2. More astrocytes elicit spontaneous Ca2+ surges in layer 1 than in layer 2/3.
A, Representative time course of spontaneous Ca2+ surges of astrocytes in L1. Numbers (1–6) correspond to astrocytes in Figure 1A. Each trace shows normalized fluorescence intensity of Ca2+ indicator OGB-1 from an individual astrocyte. Small red dots indicate period of Ca2+ surge. Vertical position of each trace was adjusted arbitrary to improve visibility. Scale bar: 50%. B, Number of astrocytes with at least one spontaneous Ca2+ surge (“active astrocyte”) per imaged area is plotted against the depth from the cortical pia. L1 had significantly more active astrocytes than L2/3. ***p<0.001, Student's t test. C, Proportion of active astrocyte for each experiment is plotted against the imaged depth. L1 had significantly higher percentage of active astrocytes than L2/3. ***p<0.001, Student's t test. D, Histograms (solid bars) and cumulative distribution (solid lines) of Ca2+ surge duration of astrocytes in L1 (blue) and L2/3 (red) are plotted. Vertical dotted lines indicate the mean duration of spontaneous Ca2+ surge. There was no significant difference in Ca2+ duration between L1 and L2/3. E, Histograms (solid bars) and cumulative distributions (solid lines) of Ca2+ surge peak of astrocytes in L1 (blue) and L2/3 (red) are plotted. L1 astrocytes had significantly higher spontaneous Ca2+ surge peak values. Vertical dotted lines indicate the mean Ca2+ surge peak (***p<0.001, Student's t test). F, Ca2+ surge peak values are plotted against Ca2+ surge duration in L1 (blue circle) and L2/3 (red triangle). There was a slight but significant correlation between Ca2+ peak value and duration in L1 (r≈0.24), but little correlation was observed in L2/3 (r≈0.07).

