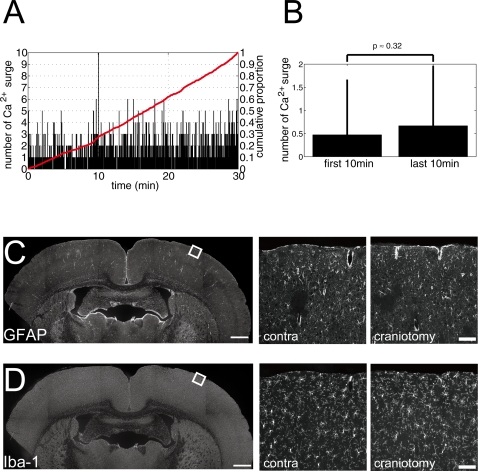
Figure 4. Condition of craniotomy assessed with spontaneous Ca2+ surge occurrence and immunohistochemistry.
A, Number of spontaneous Ca2+ surges of astrocytes of all experimental data was plotted against imaged time. Red line indicates the cumulative proportion. Apparently uniform occurrence probability of spontaneous Ca2+ surge was observed. B, Comparison of number of Ca2+ surges during the first and the last 10 min of the imaging period. No significant difference was observed (p = 0.32). C, Wide field view of immunostained cortex with astrocyte specific antibody, GFAP (left). Square indicates the imaged area with craniotomy, which is displayed in an expanded view (right, ‘craniotomy’) and compared with the contralateral side of the corresponding cortical area (middle, ‘contra’). Comparable shape of astrocyte was acknowledged. D, Wide field view of immunostained cortex with microglia specific antibody, Iba-1 (left). Square indicates the imaged area with craniotomy, which is displayed in an expanded view (right, ‘craniotomy’) and compared with the contralateral side of the corresponding cortical area (middle, ‘contra’). Similar morphology of microglia was observed. Scale bar: C, D, 1 mm (left); 100 µm (middle and right).

