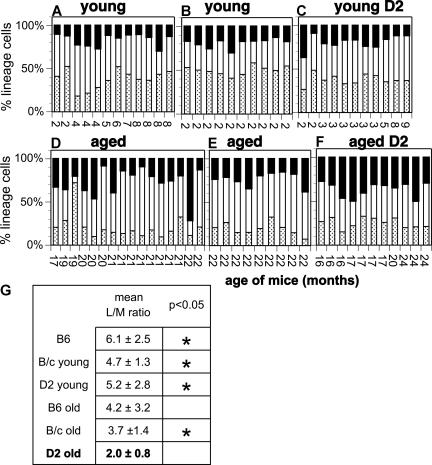
Figure 1.
Increased number of myeloid cells in the blood of aged D2. The percentage of myeloid cells (■), and B (□) and T ( ) lymphocytes in blood was measured from young (A-C) and aged (D-F) mice on the B6 (A,D), B/c (B,E), and D2 (C,F) background. Each bar represents the measurements from an individual mouse. The age of each mouse is indicated on the x-axis. Data are normalized to 100% to facilitate comparison. The mean L/M ratio and standard deviation for each group is shown in panel G. An * indicates that L/M ratios were significantly different from those obtained for aged D2 mice.

