Figure 2.
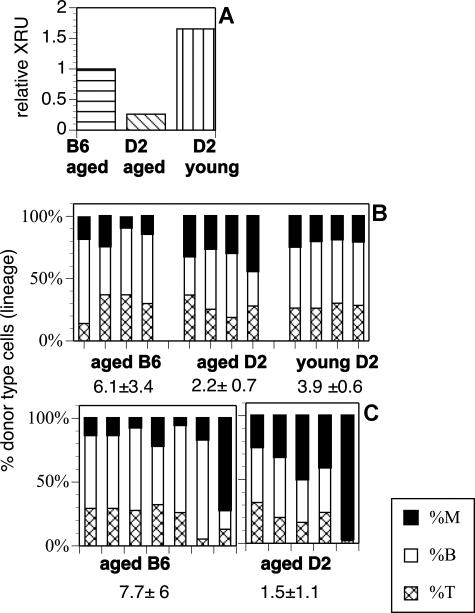
Relative repopulation units and differentiation potential of HSCs from aged mice. (A) Relative competitive repopulating units (rXRUs) in aged D2 are lower than in young D2 or aged B6 mice. Four mice were injected with 5 × 10⁵ BM cells in each group. All mice received an equal dose of competitor marrow. Horizontal stripes indicate aged B6-CD45.1 plus young B6; diagonal stripes, aged D2-CD45.1 plus young D2; and vertical stripes, young D2-CD45.1 plus young D2. Donor-type cells (CD45.1) in blood were enumerated 5 months later, and the number of rXRUs per 105 cells were calculated as described.42 (B) Lineage contribution of HSCs in competitive repopulation: Shown is the percentage of myeloid cells (■), B lymphocytes (□), and T lymphocytes (▩) of donor origin for each mouse in each group. The mice are from the experiment described in panel A. The mean L/M ratio (± SD) for each group is indicated. The difference between the L/M ratios of aged and young D2 (P = .008) is significant; the difference between aged D2 and aged B6 (P = .06) approaches significance. (C) Lineage in noncompetitive repopulation. Mice received 105 Lin− cells from aged B6 or D2 donors (noncompetitive). Each bar represents a different experiment with a different donor. The difference between the L/M ratios of D2 versus B6 mice is significant with P = .051.

