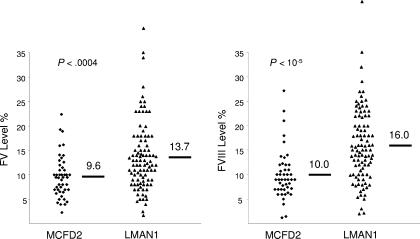
Figure 2.
Correlation of genotypes and levels of FV and FVIII in F5F8D patients. Distribution of FV levels and FVIII levels in patients with LMAN1 mutations and MCFD2 mutations. The short bars and numbers indicate the average values. To meet the assumptions of normality, before the Student t test analysis, the FV and FVII data were cube-root transformed.

