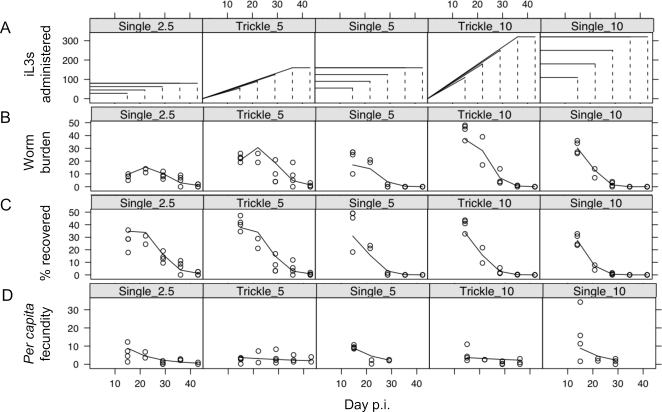
Figure 2. (A) Diagrammatic representation of the three control single dose, and two trickle dose infection regimes shown as the number of iL3s administered, which were sampled at days 14, 21, 28, 35 and 42 p.i., shown as vertical dotted lines; (B) the intestinal worm burden through time, and (C) this expressed as a percentage of the number of iL3s administered; and (D) the per capita fecundity of parasitic females.
For (B–D) each point represents data from one animal and lines the best-fit predictions from minimal models.

