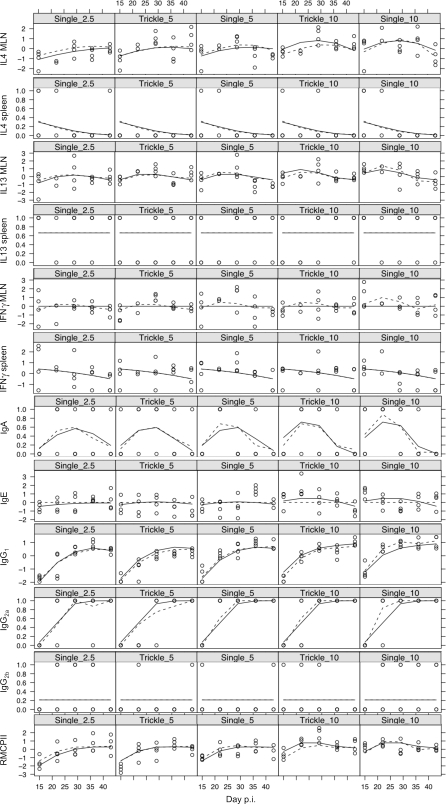
Figure 3. The temporal dynamics of 12 immune parameters in the three control single dose, and two trickle dose infection regimes at days 15, 22, 29, 36 and 43 p.i.
The concentration of IL4 and IL13 produced by splenocytes stimulated with parasite antigen and the concentration of anti-S. ratti IgA, IgG2a and IgG2b are shown as presence/absence data. All other immune parameters have been transformed and scaled to have a mean of zero and variance of 1. Each point represents data from one animal. Best-fit predictions from minimal models are shown for explanatory variables of number of worms administered (solid lines) or worm exposure time (dotted lines).

