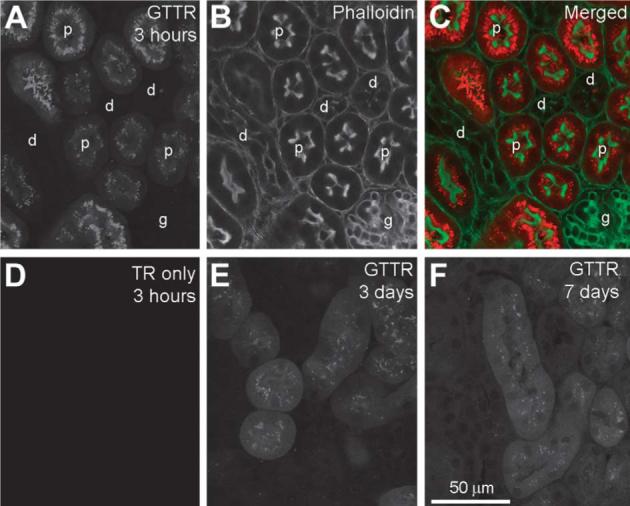
Fig. 10.

GTTR uptake in the kidney. (A) Three hours after injection, strong GTTR fluorescence occurred in proximal tubule cells (p), but not in glomerular (g) or distal tubule cells (d) as identified by phalloidin labeling (B), and merged images of A and B (C). (D) Kidney tissue 3 h after injection with hydrolyzed TR only revealed negligible fluorescence. (E) Punctate GTTR fluorescence in proximal tubule cells is less intense and less extensive than at 3 days (E) and at 7 days (F) after injection. Note the diffuse cytoplasmic GTTR fluorescence present in proximal tubule cells 3 and 7 days post-injection. Scale bar applies to all images.
