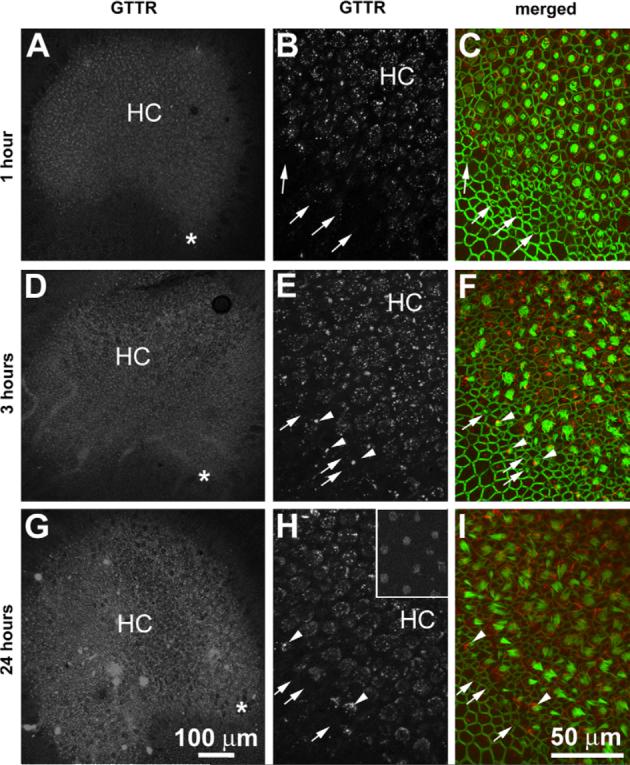
Fig. 2.

Low resolution images of the bullfrog saccule and growth zones (*; A, D, G), and higher resolution images of immature and mature hair cells (B, C, E, F, H, I) following lymphatic sac injection of GT/GTTR. (A, B, D, E, G, H) GTTR fluorescence is more prominent in mature hair cells (HC) in the central regions of the saccule. Immature hair cells at the saccular periphery (arrows) typically display less GTTR fluorescence than central mature hair cells (HC). Some peripheral, immature hair cells (arrowheads) display intense punctate fluorescence. (Inset in H) GTTR fluorescence is also associated with the hair bundles of mature hair cells. Scale bar in G applies to A and D. Scale bar in I also applies to B, C, E, F, H and inset in H.
