
Figure 3.
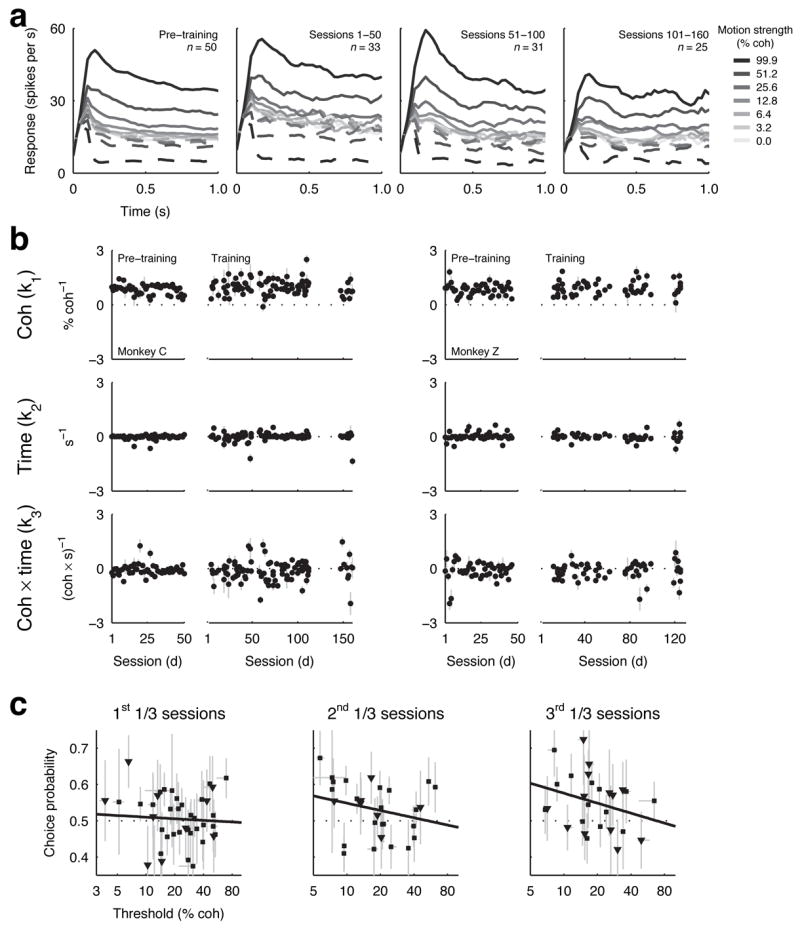
MT responses. a, Average activity of MT neurons as a function of viewing time (using 0.1-s-wide time bins with 0.025-s increments) for different motion strengths (see legend) for each neuron’s preferred (solid line) and null (dashed line) motion during different training periods for monkey C. “Pre-training” refers to responses to the motion stimulus measured while the monkey was rewarded for simply fixating a central spot, before being trained on the discrimination task. b, Coherence-, viewing time- and coherence × viewing time-dependence (Eq. 3) of individual MT neurons before and during training for monkeys C (left) and Z (right). Error bars are 68% CIs. c, Relationship between neurometric threshold and choice probability for individual MT neurons during different training periods for monkeys C (■) and Z (▼). Error bars are 68% CIs. Solid lines are linear fits.