
Figure 7.
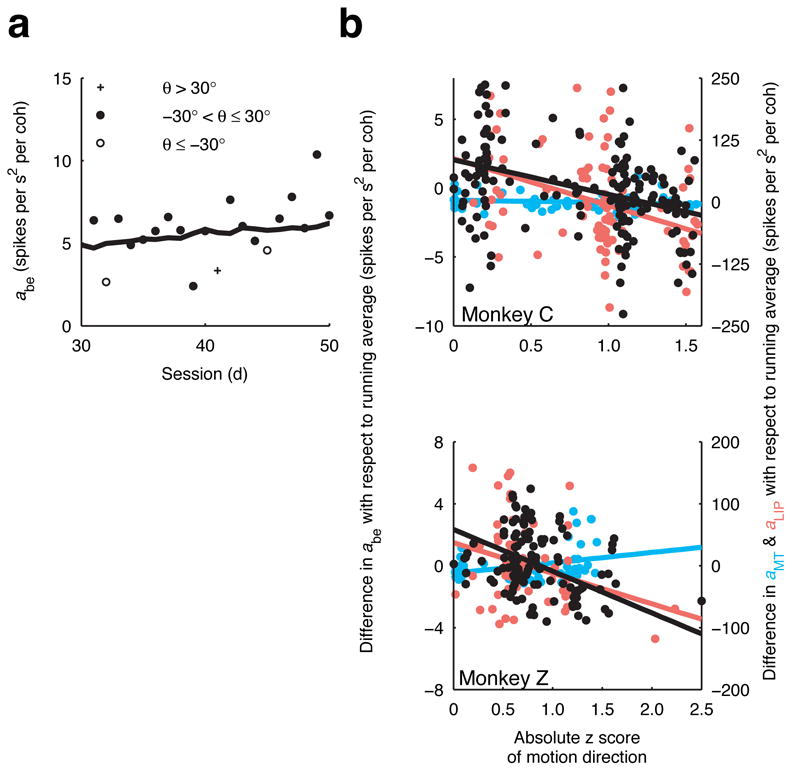
Specificity of learning. a. The coherence dependence of the sensory information (a in Eq. 4) estimated from behavioural performance from sessions 30–50 for monkey Z. The solid line is a 21-session running average. b. The difference between the coherence dependence from a given session and its 21-session running average for behaviour (black), MT (cyan) and LIP (red) responses are plotted against the absolute z score of motion direction for monkeys C (top) and Z (bottom). For a given session, the z score is computed using the distribution of motion directions used prior to that session. Thus, less frequently used motion directions will have larger z scores. Solid lines are linear fits.