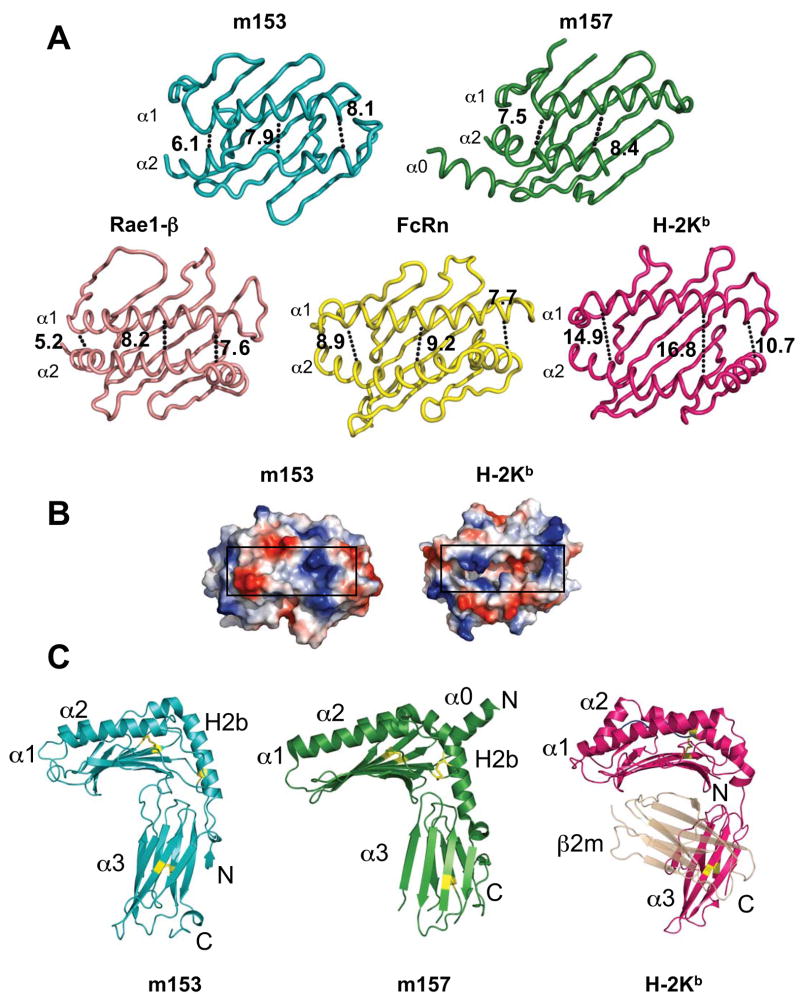
Fig. 3.
Comparison of m153 with m157, H-2Kb, Rae-1β and rat neonatal FcR. A. Ribbon diagrams of the platform domains of m153, m157, Rae1β, FcRn and H-2Kb. The width of the groove of each molecule is indicated in Å and was measured at both ends and in the middle at comparable residues of the α-helices. B. Surface representation of the peptide-binding domain of H-2Kb (groove shown without any peptide) and the corresponding region of m153. Black rectangles indicate the groove. C. Comparison of m153 chain B with m157 and H-2Kb. The α1α2 and H2b-helices, α3-domain, and N- and C-termini are labeled. PDB accession codes: 2NYK, 2VAA, 1JFM and 3FRU.

