
Fig. 2.
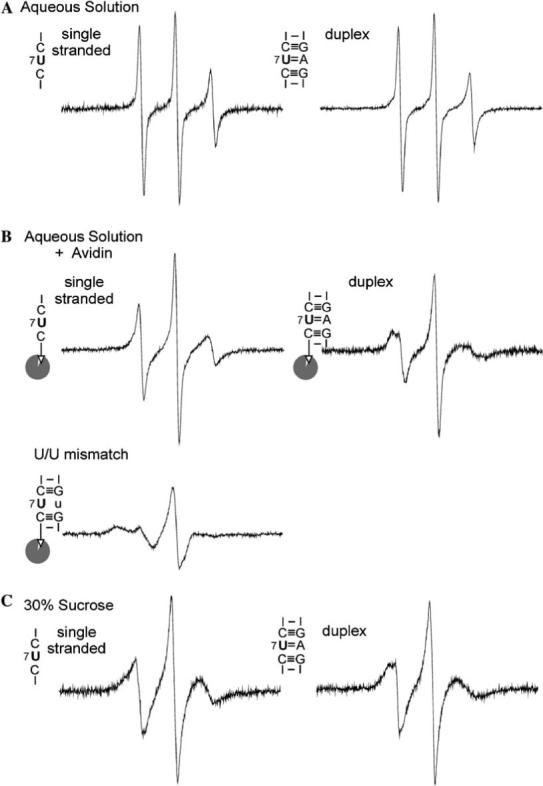
EPR spectra for various secondary structure elements at position 7 of the SDR RNA, obtained according to procedures described in Materials and methods. The corresponding secondary structure elements, as defined by nearest neighbor sequences around the labeling site, were indicated next to each spectrum. (A) Spectra obtained in an aqueous solution containing 100 mM NaCl and 10 mM sodium phosphate, pH 6.8. The SDR1su7-Ra concentration was 43 μM. (B) Spectra obtained with avidin-bound bSDR1su7-Ra in an aqueous solution containing 100 mM NaCl and 10 mM sodium phosphate, pH 6.8. The labeled RNA concentrations were estimated to be ∼50 μM, with an avidin/RNA ratio of 1.1:1. The avidin contains four biotin binding sites [34]. Control experiments showed that lowering the avidin/RNA ratio to 0.28:1 did not affect the observed EPR spectrum, thus excluding interference from possible spin–spin interaction due to two labeled RNAs binding to the same avidin molecule. Formations of RNA duplexes in the A/U pair and U/U mismatch were confirmed by native gel shift assays. (C) Spectra obtained in 100 mM NaCl, 10 mM sodium phosphate (pH 6.8), and 30% (w/v) sucrose. The presence of 30% sucrose increases the estimated τR of the SDR duplex to 13 ns, thus minimizing spectral effects due to uniform molecular tumbling. Signal from a small amount of free nitroxide was subtracted as described [13].