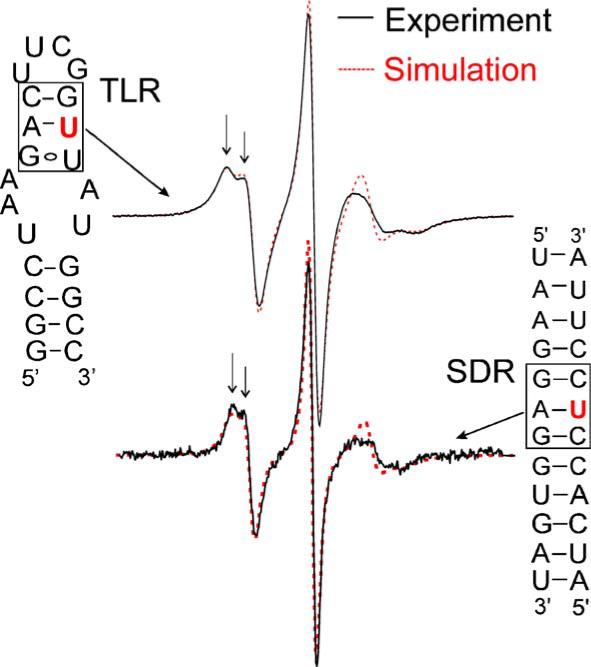
Fig. 3.

Spectra at stacked A/U pairs. Spectra (solid line) of Ra labeled at base positions of uridines situated in stacked Watson–Crick “A/U” pairs (indicated by boxes) in two different RNAs are shown. The two spectra are very similar, with splitting at the low field peak (indicated by arrows) indicating anisotropic motion of the nitroxide. Spectral simulations using the MOMD model are shown as dotted lines. The spectrum for the TLR site was obtained in 500 mM NaCl, 50 mM Mops, pH 6.6, and 33.8% (w/v) sucrose, and was simulated using rotational diffusion tensors Rx = 1.45 ns, Ry = 1.42 ns, Rz = 1.24 ns, and an order parameter of 0.46 [13]. The spectrum for the SDR site was obtained in buffer B using an avidin-tethered RNA as described (Materials and methods), and was simulated using Rx = 1.05 ns, Ry = 1.05 ns, Rz = 1.45 ns, and an order parameter of 0.36. The same set of g tensor, A tensor, and diffusion tilt angle (βD) values was used in the SDR and TLR simulations [13].
