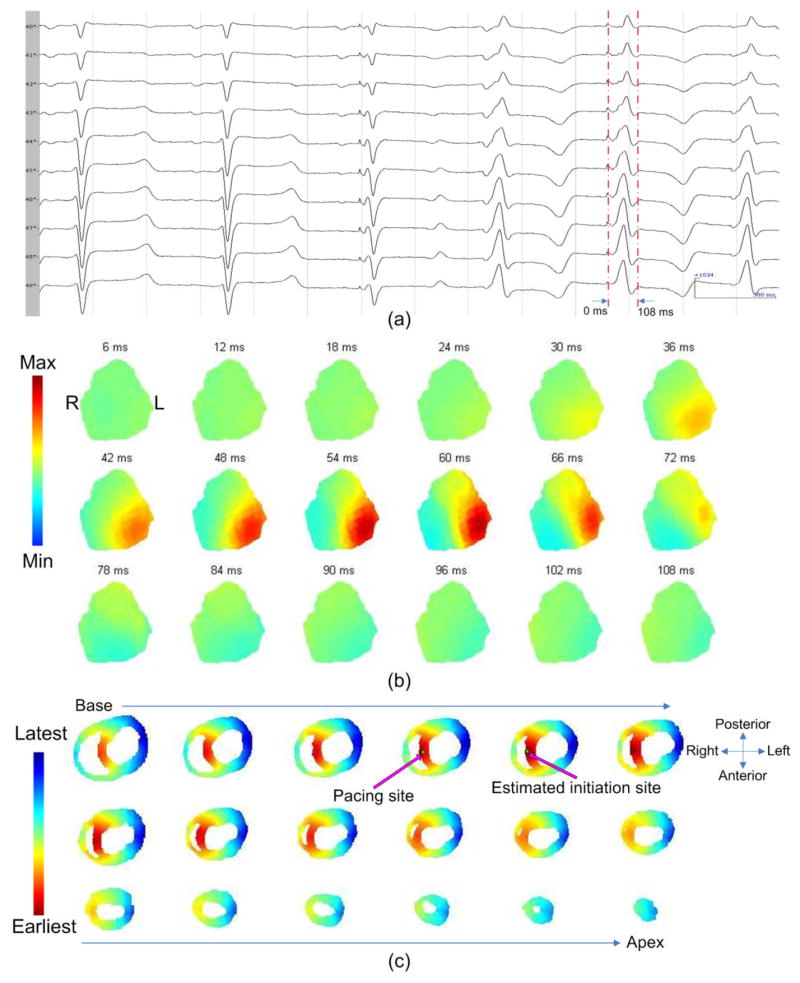
Figure 2.

(a): The ECG waveforms recorded from the body surface electrodes with corresponding time intervals. (b): The body surface potential maps. (c): The location of the initiation site and the 3D activation sequence (AS). The relative geometry of the heart is shown by horizontal sections, arranged from base to apex. The precise location of the initiation site and the estimated location of the initiation site are indicated. The 3D AS is shown on the horizontal sections.
