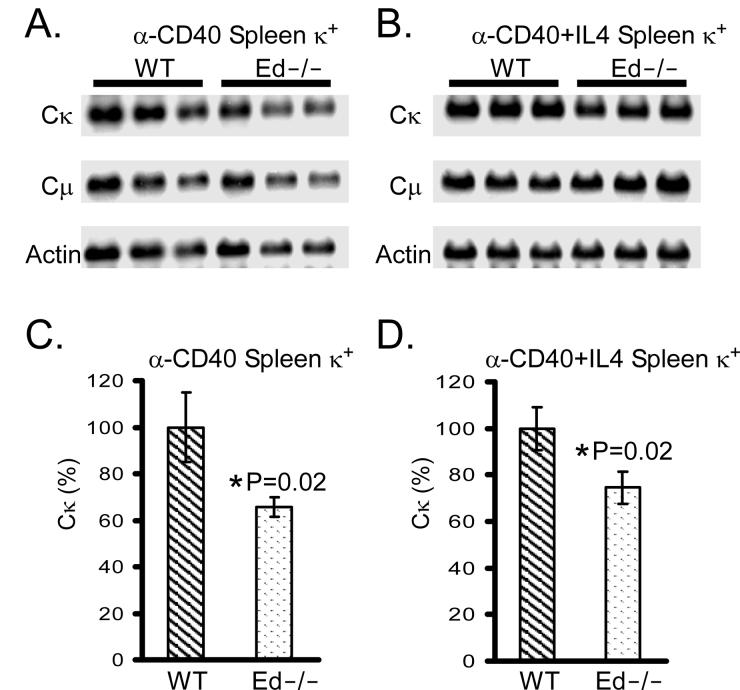
FIGURE 6.
Northern blot analysis of Igκ expression in T-cell-dependent stimulated splenic B cells. A and B, Total RNA from splenic Igκ+ cells cultured for 4 days with anti-CD40 (A) or anti-CD40+IL4 (B) was blotted and hybridized first with a Cκ probe and then sequentially with β-actin and Cμ probes. C, The Northern blot signals of anti-CD40 stimulated splenic Igκ+ cells were quantitated by PhosphorImager analysis. The levels of Igκ expression were normalized by β-actin (Cκ/β-actin) or Cμ (Cκ/Cμ) expression. The Cκ/β-actin ratios of WT mice were set as 100% expression. The percentages of κ expression (Cκ (%), y axis) in Ed−/− mice were calculated as: [(Cκ/β-actin ratio of Ed−/− mice)/(Cκ/β-actin ratio of WT mice)] ×100%. Statistical significance was determined by a paired Student's t test. D, The Northern blot signals of anti-CD40+IL4 stimulated splenic Igκ+ cells were quantitated by PhosphorImager analysis. The percentages of Igκ expression in Ed−/− mice were calculated as described in C.

