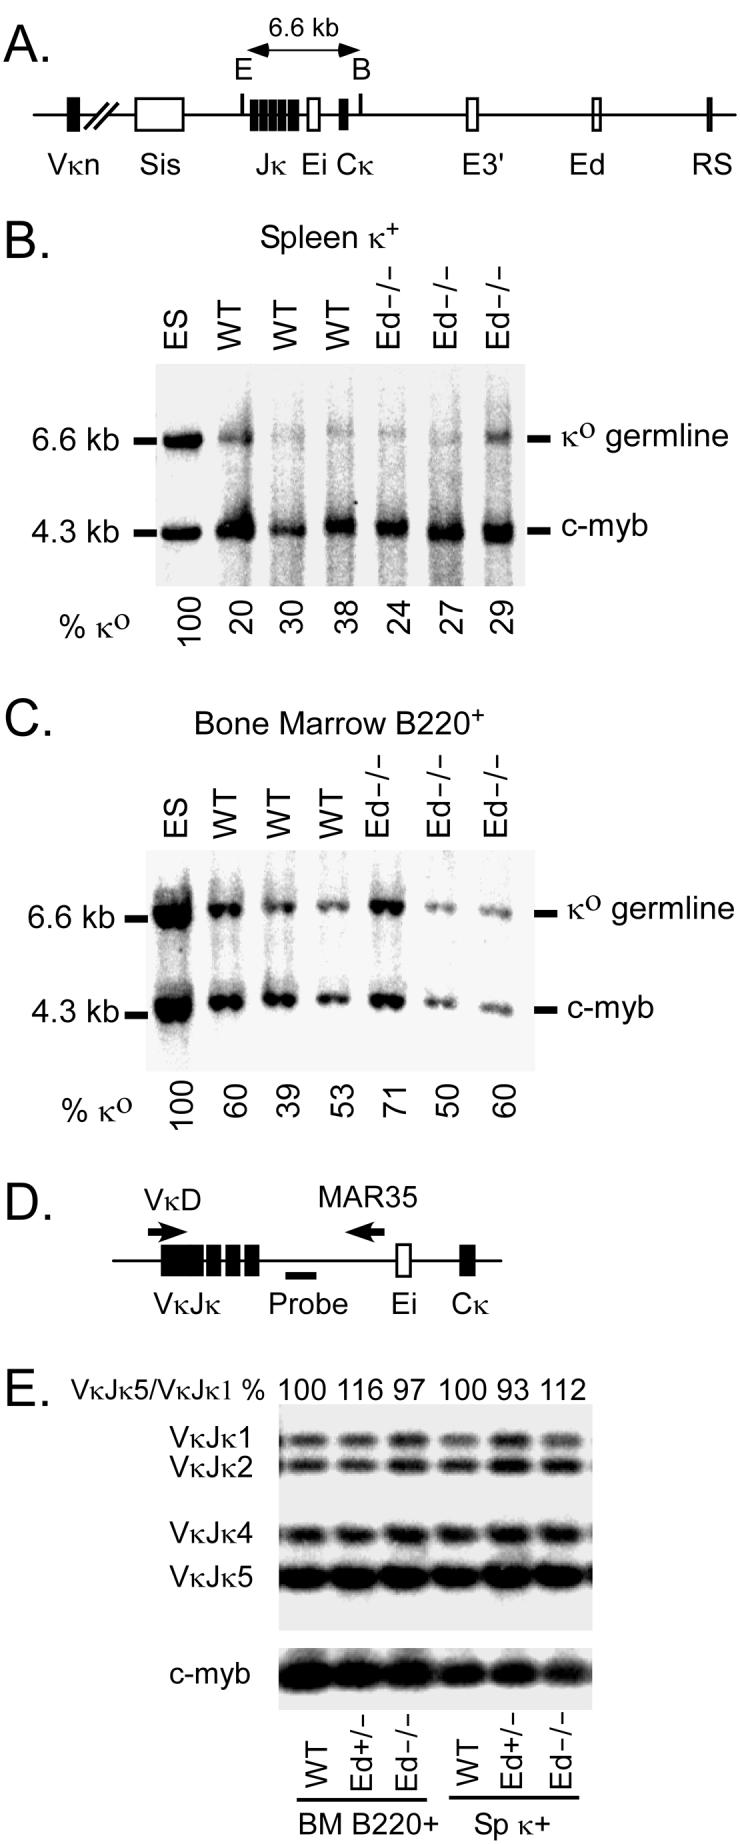
FIGURE 7.

Analysis of Vκ-Jκ rearrangement levels by Southern blotting and quantitative PCR. A, Schematic diagram of the Southern blot assay for Vκ-Jκ rearrangement. E=EcoRI; B=BamHI. B , Electrophorectically resolved genomic DNA from splenic Igκ+ cells that had been digested with EcoRI + BamHI and transferred was hybridized with Cκ and c-myb probes. The amount of EcoRI + BamHI digested DNA was normalized by the c-myb signal. Igκ germline (κo)/c-myb ratio in ES cells was set as 100%. The % κo for each sample were calculated as: [(κo /c-myb in samples)/(κo/c-myb in ES cells)] ×100%. C, Bone marrow B220+ cells genomic DNA was analyzed as described in Panel B. Data in B and C are representative of at least two independent experiments. D, Schematic diagram of the quantitative PCR assay used for VκJκ rearrangement. The positions of VκD and MAR35 primers are indicated by the arrows, and the probe used for the Southern blot is indicated by a thick line. E, Analysis of Jκ regions usage in splenic κ+ and bone marrow B cells. VκJκ rearrangement PCR products were electrophoretically separated on agarose gels and the intensities of VκJκ1 to VκJκ5 bands were quantitated by PhosphorImager analysis of the resulting Southern blot. The VκJκ5/VκJκ1 ratio of WT samples were set as 100%, and the ratio of Ed+/− and Ed−/− samples are shown in the figure. The Southern blot results of PCR amplification of c-myb are shown at the bottom, which were used to control for the amount of genomic DNA template in PCR reactions.
