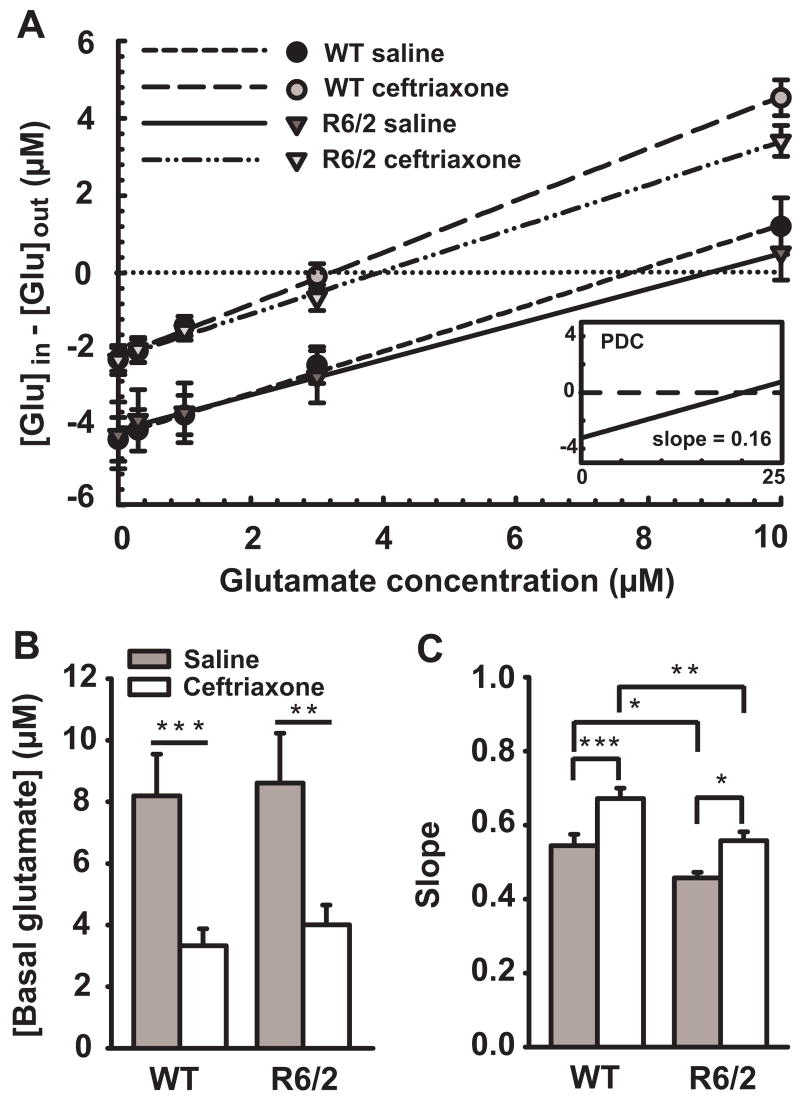
Figure 4.
Ceftriaxone decreases the basal level of extracellular glutamate and increases its uptake as measured by no-net-flux microdialysis with CE-LIF for glutamate. A, Averaged linear regressions of the no-net-flux plots. Positive numbers on the y-axis indicate diffusion to and negative numbers indicate diffusion from the probe based on the concentration of applied exogenous glutamate. The point of no-net-flux (y = 0 μM; horizontal dotted line) corresponds to glutamate equilibrium between tissue and microdialysis probe revealing the level of extracellular glutamate. The slope of each line for each group corresponds to probe recovery, reflecting the degree of glutamate uptake (i.e., increases in slope indicate increases in uptake). Note that PDC markedly decreased the slope of the no-net-flux regression (inset). B, Mean basal glutamate levels. Ceftriaxone decreased basal glutamate in WT and R6/2 mice. C, Mean glutamate uptake. R6/2 mice exhibited reduced glutamate uptake compared to WT mice. Ceftriaxone increased glutamate uptake in both WT and R6/2 mice. Note that ceftriaxone treatment restored glutamate uptake in R6/2 mice (mean slope = 0.558) to that of WT saline (mean slope = 0.544). Although glutamate uptake in ceftriaxone-treated WT mice was greater than in R6/2 mice treated with ceftriaxone, the magnitude of the ceftriaxone-mediated increase in glutamate uptake was equivalent. For A, B and C, n = 10 for WT saline, n = 8 for WT ceftriaxone and R6/2 ceftriaxone, n = 9 for R6/2 saline. *p < 0.05, **p < 0.01, ***p < 0.001. Error bars represent SEM.

