
Fig. 2.
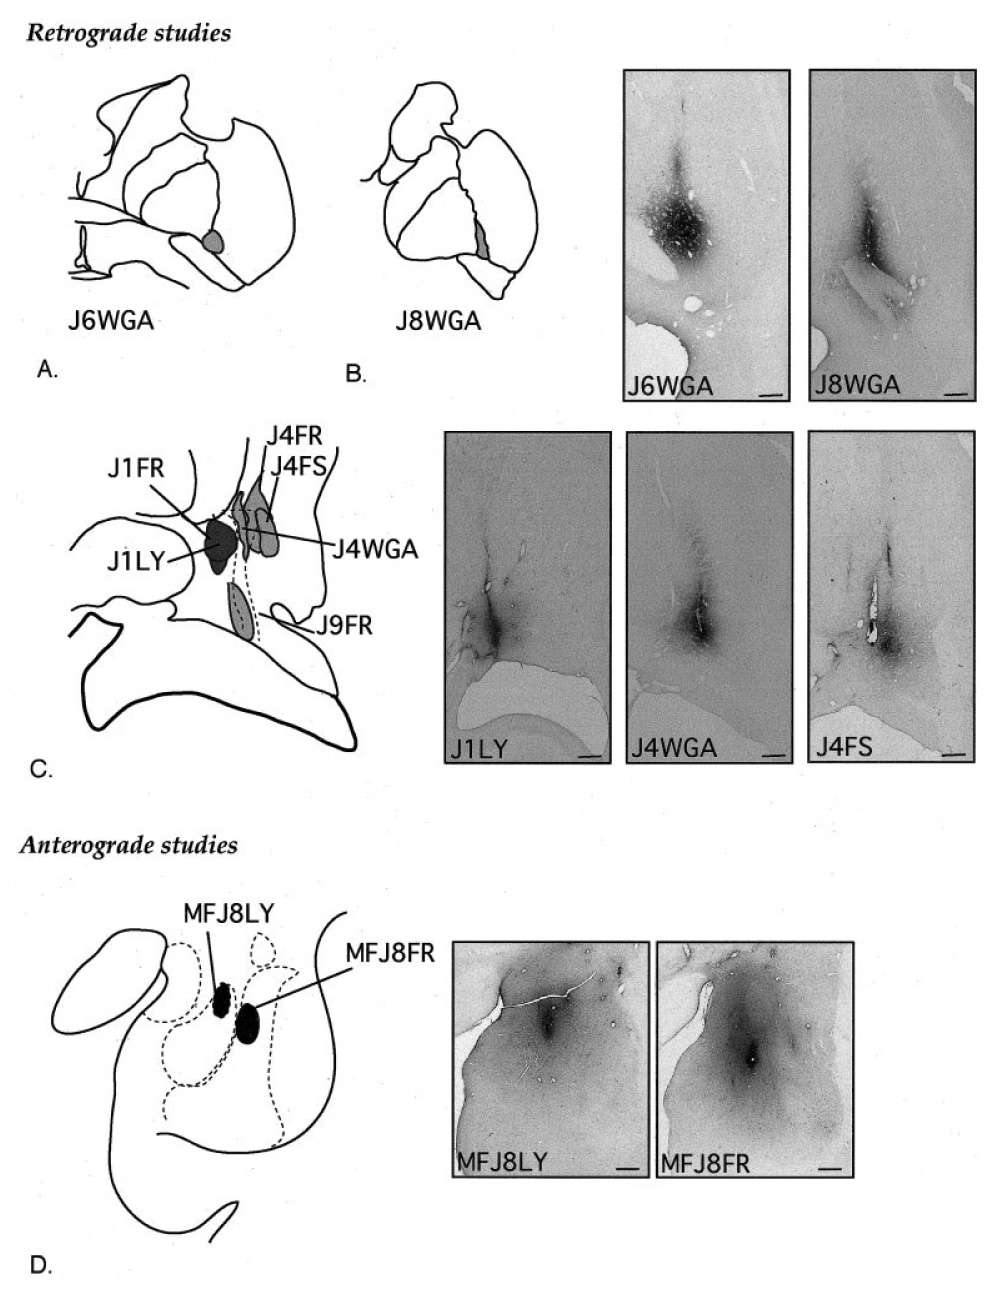
A–C: Schematic of retrograde injection sites in the central (A,B) and caudal (C) ventral striatum and central nucleus, with photomicrographs of representative injection sites. DAB staining of electrode tracks is a nonspecific response to gliosis and is not due to leakage of tracer. The dotted line in C represents the CaBP-poor zone. D: Schematic of anterograde tracer injection site placement in the amygdala, with photomicrographs of each. Scale bars = 1 mm in B–D.