
Fig. 4.
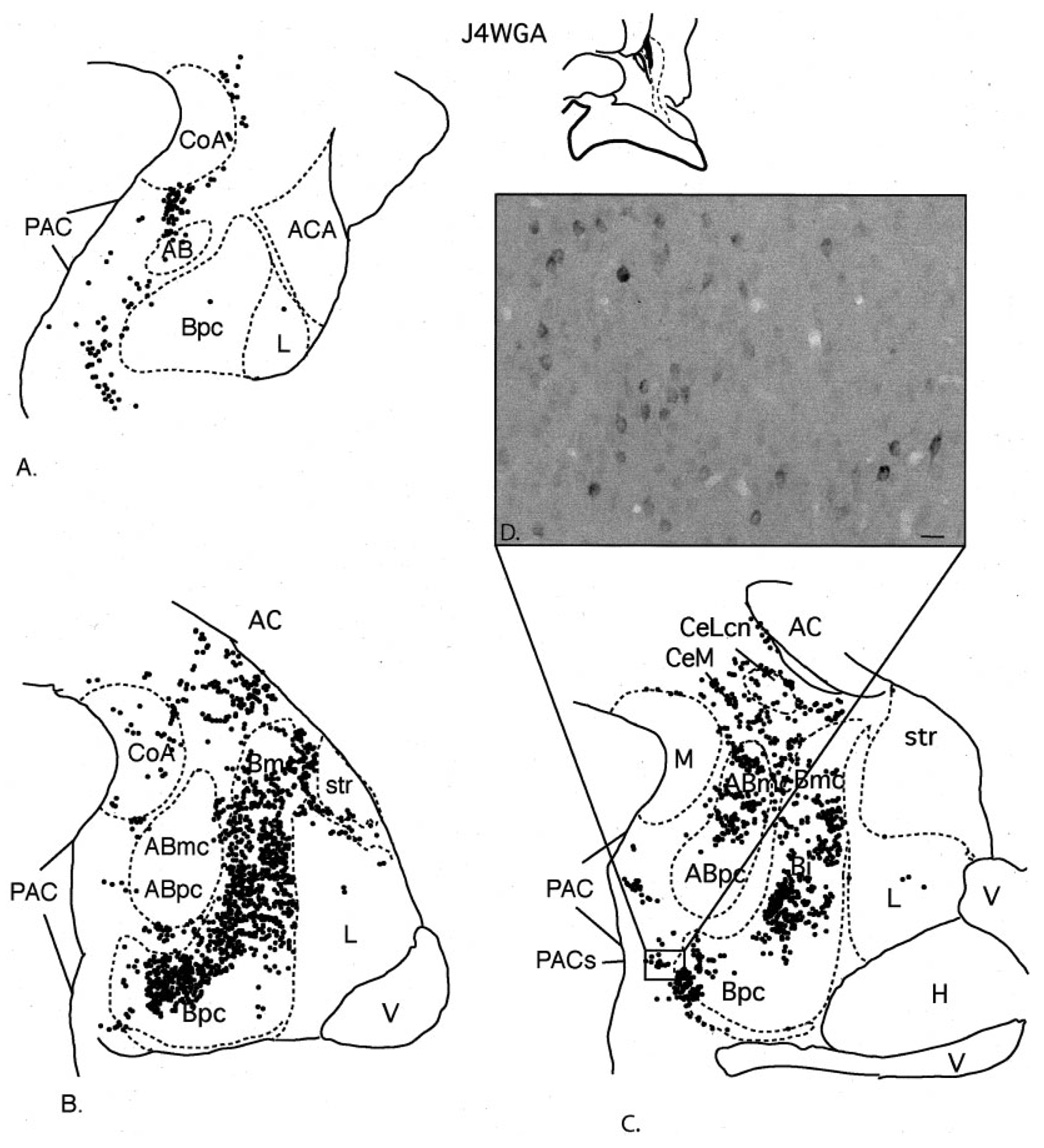
Case J4WGA. A–C: Schematic of the distribution of retrogradely labeled cells at three rostrocaudal levels of the amygdala following an injection in the CaBP-poor zone. Each dot = 1 cell. D: Photomicrograph of labeled cells in the PACs transition with the Bpc. For abbreviations, see list. Scale bar = 25 µm in D.