
Figure 2. Frequency distribution.
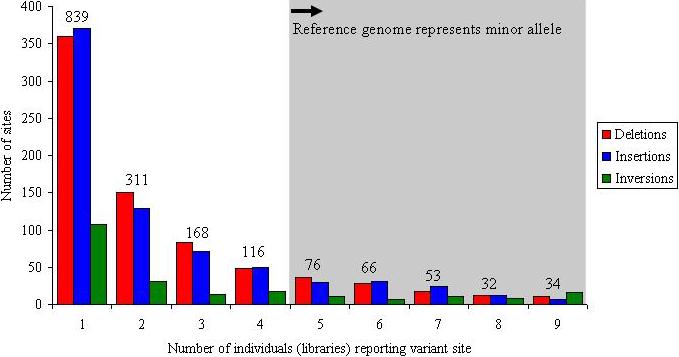
Plot showing the number of times that a particular structural variant was detected on the basis of ESP analysis for nine fosmid libraries (eight HapMap, plus G248): 15% (261 of 1,695) of the sites seem to represent a more common sequence configuration (major allele) with respect to the human reference genome; 49% (839 of 1,695) of the validated sites are observed once, suggesting that saturation has not been achieved. The numbers above the columns report the total number of events for each frequency class.