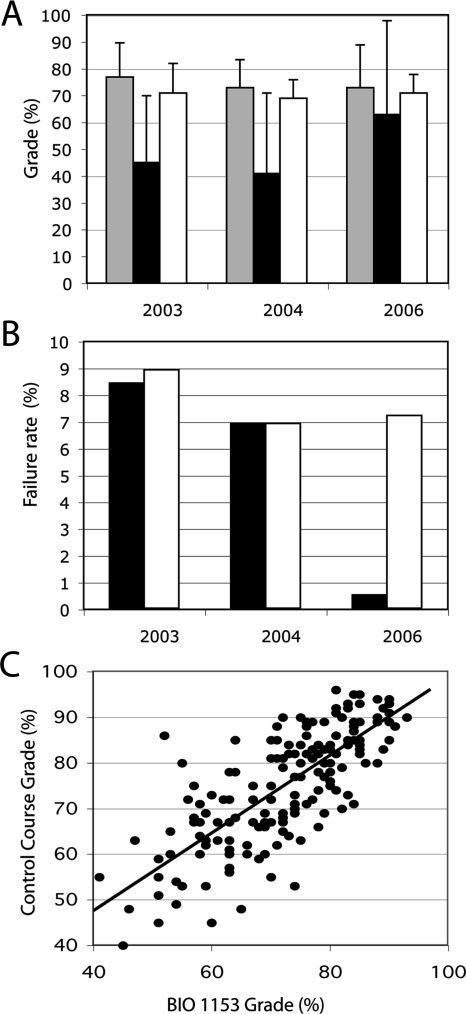
Figure 4.
Assessment of student performance. (A) Grades for multiple-choice questions (gray bars) and problems (black bars) for both cell biology and for a control course (white bars) for the 3 yr of the project. (B) Course failure rates for BIO1153 and a control course for 3 yr (the number of students was 234 in 2003, 224 in 2004, and 206 in 2006). (C) A comparison of grades in the control course with those obtained in BIO1153.

