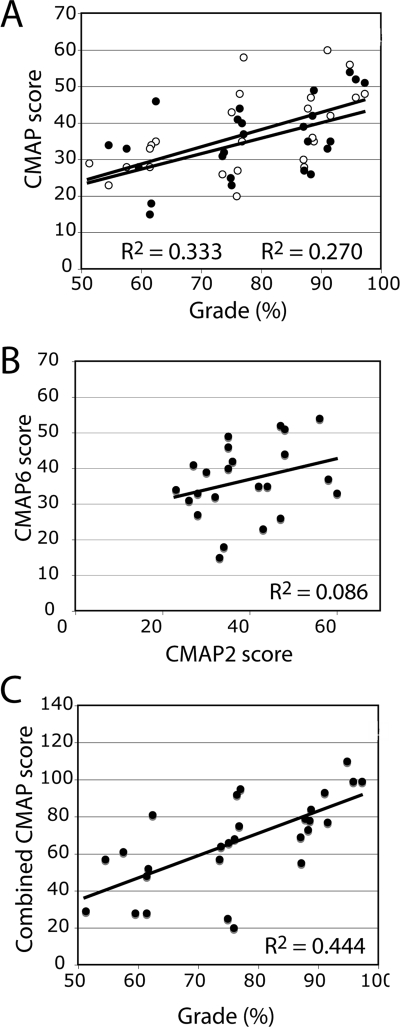
Figure 5.
Relationship between final exam results and CMAP scores. Thirty students were selected from the class to represent high (top 10), medium (around the mean), and low (bottom 10) final exam grades. (A) Concept maps for the microscopy (CMAP2, open circles, example of adequate hierarchy) and energy (CMAP6, closed circles, example of adequate horizontal links) for all students were scored and individual CMAP scores were plotted as a function of final exam grade. (B) CMAP scores plotted as a function of one another. (C) Scores from the two CMAPs were combined and plotted as a function of final exam grade.

