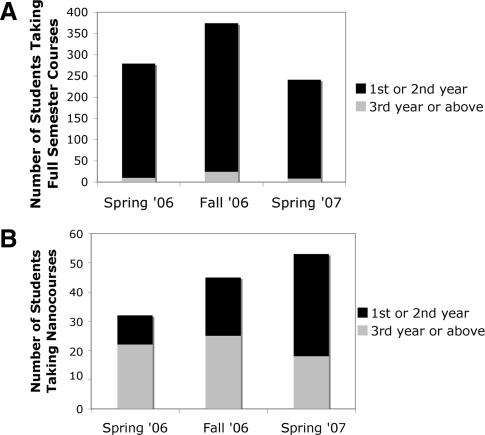
Figure 2.
A greater fraction of the students taking full nanocourses were upper-year students compared with students taking full-semester courses for credit in the same three semesters. (A) Data are from all full-semester graduate-level courses offered by DMS during Spring 2006, Fall 2006, and Spring 2007 semesters (from DMS course registration records). Data were reported as the number of junior and senior students taking individual full-semester courses each semester. These numbers were combined, and are reported here as absolute numbers of students taking all full-semester courses each semester. Note that individual students who took more than one full-semester course are represented more than once, because we did not have access to the records indicating which specific students took these courses. Black bars represent the absolute number of students in their first and second year of graduate school taking full-semester courses for credit, while gray bars represent the absolute number of students in their third year or above. (B) This graph includes data from all nanocourses offered in the same semesters as were reported in A. Data are reported here as numbers of individual students taking nanocourses during each semester. Because we did have access to the records of individual students taking each of these courses, individual students are only represented once in each of the columns of this graph. Note that the scale of the two graphs is different.

