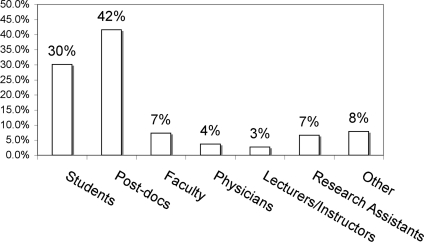
Figure 3.
Nanocourses attract members of our community other than students. As described in Figure 1, during the first session of each nanocourse, attendees were asked to report demographic data on an attendance sheet. This graph includes the combined attendance data of all nanocourse attendees during Spring 2006, Fall 2006, and Spring 2007 semesters, who reported their attendance and job title on the attendance sheet. “Other” refers to a variety of job titles that were indicated on the survey forms.

