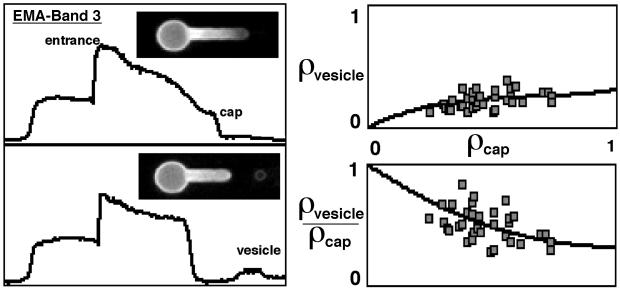
Figure 4.
Fluorescence micrographs and corresponding intensity profiles of EMA-labeled band 3. Intensity profiles were plotted as relative fluorescence intensity (ordinate) vs. distance along the deformation axis (abscissa). After microdeformation labeled band 3 exhibited a density gradient similar but less steep than that of labeled actin (Upper Left). After vesiculation, and in contrast to actin, the resulting vesicle clearly showed membrane-associated labeled band 3 (Lower Left). The band 3 vesicle density (ρvesicle) showed a nonlinear dependence on the cap density prior to vesiculation (ρcap) (Upper Right). This dependence suggested that as ρcap decreased, a greater fraction of band 3 in the prevesiculated cap was partitioning into the vesicle (enrichment) (Lower Right).

