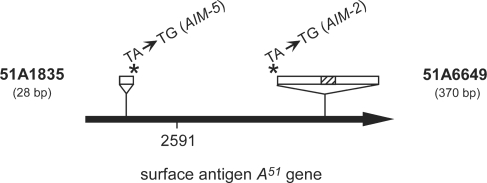
Figure 2.
Schematic map of P. tetraurelia gene A51. IESs 51A1835 and 51A6649 (white rectangles) are displayed on top (not to scale), with the hatched box representing a 29-bp internal IES embedded within IES 51A6649. The position of each point mutation is marked by an asterisk and the name of the corresponding mutant strain is indicated between brackets. The position of IES 51A2591, used as a wild-type control in this work, is also indicated.

