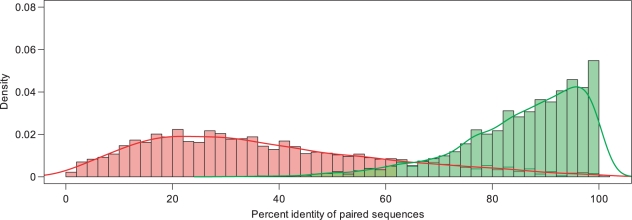
Figure 2.
Distribution of the percent identity between aligned orthologous protein and transcript pairs from the human and mouse genomes. The x axis indicates the percent identity of paired orthologous sequences, and the y axis indicates number of orthologous pairs normalized to the total number of input pairs. The aligned identities of protein sequences were obtained using UniGene and are shown in green. The aligned identities of the processed transcription units were obtained using GOOD and are shown in pink.

