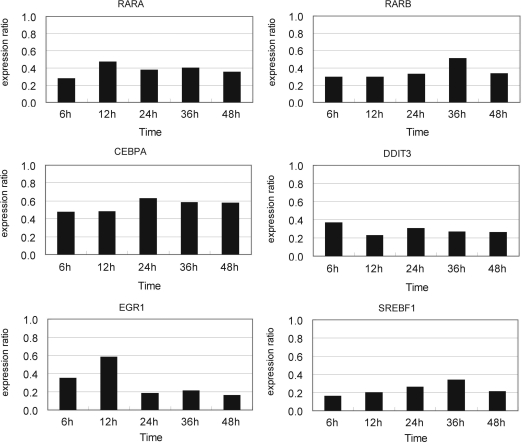
Figure 2.
Expression levels of the six selected TRF genes suppressed by respective siRNAs at several time points. HepG2 cells were transfected with each of the specific siRNAs (20 nM, final concentration) 24 h before ATRA addition, and the total RNA was extracted 6, 12, 24, 36 and 48 h after ATRA addition. The expression ratio was calculated according to the 2−ΔΔCT method as described in ‘Materials and methods’ section with GAPDH mRNA and negative control siRNA as the internal reference and the calibrator, respectively. The data are the averages of two biological replicates.

