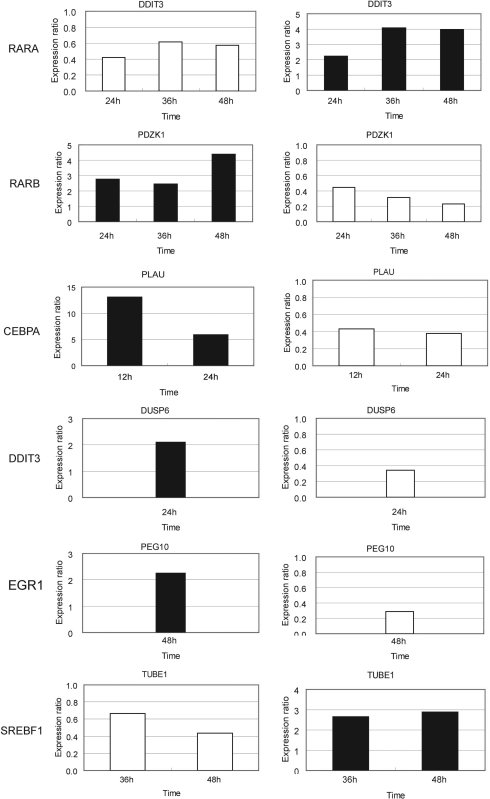
Figure 3.
Reverse perturbation patterns of gene expression induced by RNAi knockdown and ATRA treatment. Expression perturbations of the selected TRF-regulated genes by knockdown of the corresponding TRF genes are on the left. The expression ratio was calculated as in the legend to Figure 2. The reversed regulatory pattern was observed by ATRA treatment (right). The expression ratio was normalized by the expression level observed with DMSO treatment and the data are the averages as described in the caption of Table 3. Black and white bars indicate upregulation and downregulation, respectively. Data for the time points when the clear reverse regulatory patterns were confirmed are shown.

