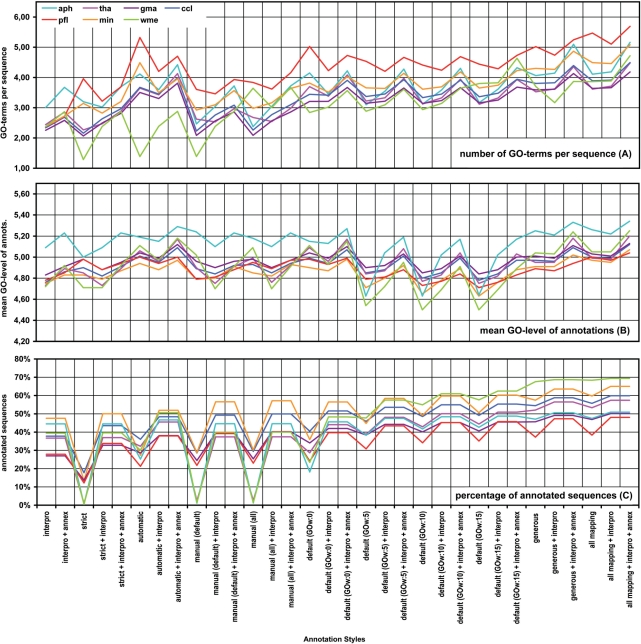
Figure 5.
Results of the annotation performance evaluation task. The number of GO term per sequence (A), the average level of GO term (B) and the percentage of successfully annotated sequences over the full dataset (C) are given for seven different datasets annotated at 32 different annotation styles (see Methods section for details).

